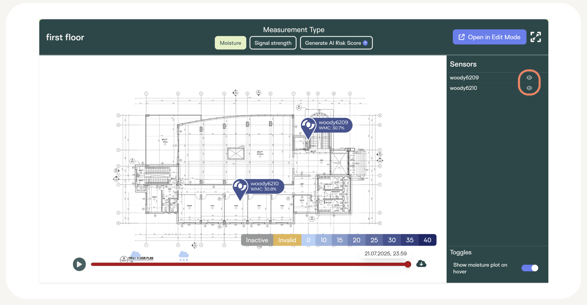
When you enter the Blueprint page you will by default be in View mode. Here you can see every sensor attached to the blueprint. If you hover over the sensor in the sidebar it's corresponding icon will highlight itself in the blueprint (and vice versa). You can show/hide sensors without having to remove them from the blueprint, just click the eye icon (see picture below).

- Click on Open in Edit mode

- Then press on the calendar icon on the left and select the desired time period
Moisture

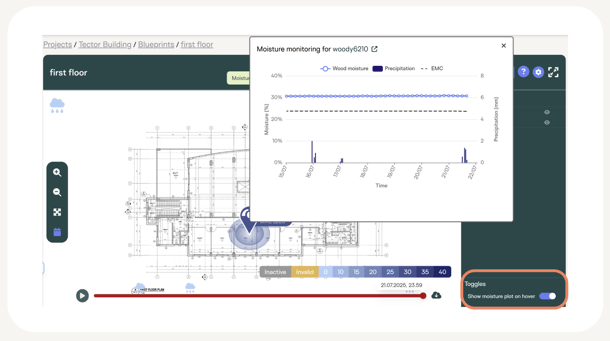
When selecting Moisture as the Measurement Type, you will see all sensors marked with a shade of blue corresponding to the latest moisture value of the selected time period.

The cloud in the top left corner appears if there is forecasted rain for the given day and allows you to see temperature, humidity and rainfall volume.
Signal

If you chose Signal strength as the Measurement Type, then the sensors will change their colour to a shade of green reflecting the strength of their signal. If you see that some sensors have a weak signal, then consider positioning a gateway closer to them to avoid battery drain.
Risk score
Risk score is an AI-powered tool designed to simplify moisture management specifically for flat roofs. By analysing data from sensors and environmental conditions, it generates a risk index indicating the likelihood of moisture issues, such as water ingress.

Risk score levels:
- 0: No issue detected.
- 2: Monitor area—sensor readings are abnormal, but no immediate problem.
- 4: Action required—high likelihood of moisture ingress.
To learn more visit this page.